

Is climate change real? Is the Earth warming? Are humans the main cause of warming?
If you are like me, you believed all of the headlines. Global warming is mostly caused by humans burning fossil fuels. This heating phenomenon is causing huge changes in the climate. Ice caps are melting, reefs are bleaching and dying, the sea level is rising, the intensity of storms is worse, there are more forest fires, etc.
You would have to be living in a cave not to know this is all happening. It is on the news almost every night.
A few years ago, I started looking at the scientific data. In summary:
There is almost no data to support the catastrophic headlines you see.
However, there is a lot of published data to show that the climate is not changing at alarming rates.
Based on the comments, I think a lot of people did NOT read this last sentence. The Earth is warming. Climate change is happening – it is always happening. But …. climate change is not changing at an alarming rate.
What if all of the information you have been fed is wrong?
It means that most of the government efforts, using your hard-earned tax money, are a waste. It means alternative energy sources won’t solve anything. It means governments and society are doing the wrong things to make our future better.
This is so serious that we all need to start asking questions. We need to demand data to support the news claims.
The purpose of this blog post is to collect and summarize the data we do know. The post will be published shortly, but I will continually add new data as I find it. In some ways, it is a documentation of my journey towards the truth. If you find some data, for or against climate change, please let me know in the comments, and I will add it.
I am not a climate denier. I am a climate realist!
Global Warming vs Climate Change
About 8 years ago, we talked about global warming. The temperature is rising, and that would cause a number of problems. Then, suddenly, everyone was talking about climate change as if the two things were the same. They are not the same.

Global warming means that the Earth and the air above it are getting warmer. It does not mean higher intensity storms or more or less rainfall, although there is some effect on such things. It is simply a measure of the temperature.
Scientists agree that the Earth is warming. But scientists do not agree on the cause of this warming.
Headlines such as “97% of scientists agree humans are causing global warming” are completely wrong. No such survey was ever conducted.
Many top scientists are quite sure humans are not causing global warming.
What about climate change? Scientists agree that the climate is changing. It always changes and has done so for millions of years. It is also clear that we do not understand the effects of various forces on climate change. Most claims about future climate change are at best “estimated guesses” based on limited knowledge.
Here is just one example. We have very little understanding of how clouds affect climate change. More clouds mean less solar radiation reaches the ground. But they also trap heat against the surface of the Earth. More moisture in the air causes more clouds, and water vapor is just as good a greenhouse gas as CO2. Do clouds affect the heating of Earth more than CO2? What effect do more clouds have on climate change? Scientists agree that we don’t know.
Is Climate Change a Real Threat?
The majority of headlines say YES.
Melting Ice Threatens Shoelines
The Climate Crisis – A Race We Can’t Win
How Climate Change Is Causing World Hunger
Climate Change Makes Hurricanes More Destructive
Al Gore, a Nobel prize winner, said this in 2009, “There is a 75 percent chance that the entire north polar ice cap…during some of the summer months, could be completely ice-free within five to seven years.”
It is now 16 years later, and the ice cap has lots of ice even in summer.
Almost none of the predictions from climate activists have come true. Hurricanes and storms have not gotten any worse. The number of forest fires is decreasing. Increased CO2 is making plants grow better and allowing us to grow more food, not less. Sea levels are not significantly rising. Coral reefs are growing in size, not dying.
We need to understand climate change better so that we can adapt and make changes to accommodate it. There is no real evidence that our near-term lives are threatened or that our way of life will suddenly need to change.
The rest of this post will look at specific cases to investigate the reality of Climate Change.
What Does The IPCC Say?
The International Panel on Climate Change (IPCC) is the global organization tasked with evaluating climate change. It takes data from thousands of scientists and summarizes what we know.
Climate activists, news organizations, politicians, and the majority of the population have the understanding that the IPCC makes the following claims:
- Climate change is an emergency, and we need to act now.
- Extreme weather is bad and getting worse due to greenhouse gases.
What does the IPCC actually say?
You can read the full report for yourself. A summary of the current climate situation can be found in the IPCC AR6 WG1 report, chapter 12, table 12.12, section 12.5.2. You can read the details in the report, or watch a video highlighting them from a lecture given by Ross McKitrick, University of Guelph. The latter is much easier to digest and uses actual quotes.

What the IPCC actually says, in both the AR5 and AR6 reports, is the following.
There is no evidence of climate change, beyond natural variability, for the following:
- River floods
- Heavy precipitation
- Landslides
- Drought of all types
- Severe windstorms
- Tropical cyclones
- Sand and dust storms
- Heavy snowfall and hail
- Ice storms
- Coastal flooding
- Marine heat waves
- Ocean acidification
- Risk of fire
The evidence for climate change, over and above normal variability, does not exist. There is, however, evidence of global warming, which has resulted in glacier ice melt and permafrost melting.
The IPCC is in agreement with most of the points made in this post.
Reality:
- The IPCC report suggests there is no climate change.
- The IPCC confirms the existence of global warming.
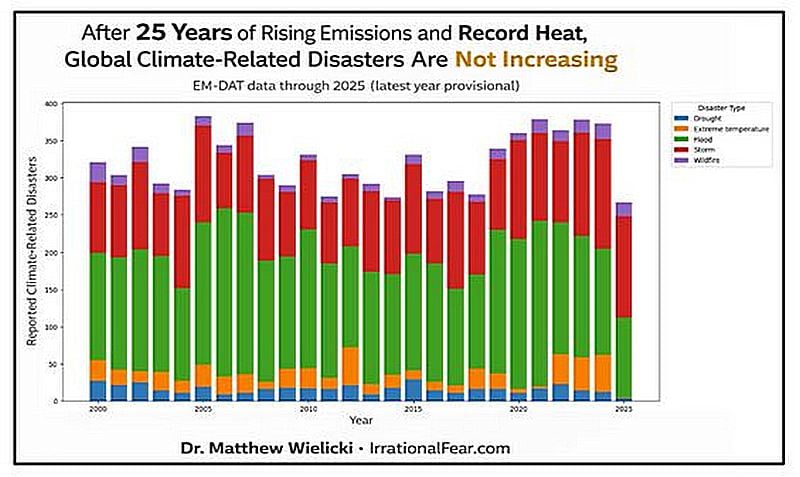
Climate-Related Disasters
If the climate were changing rapidly and causing a crisis, you would expect that climate-related disasters would also be on the rise. But …… they that is not happening.
Is the Arctic Melting?
Let’s first look at Al Gore’s prediction: the Arctic is melting.
Pictures do show less ice in the Arctic, but this is just surface ice. Most of the Arctic ice is below sea level. Here is the data from the Canadian Ice Service, Environment Canada.
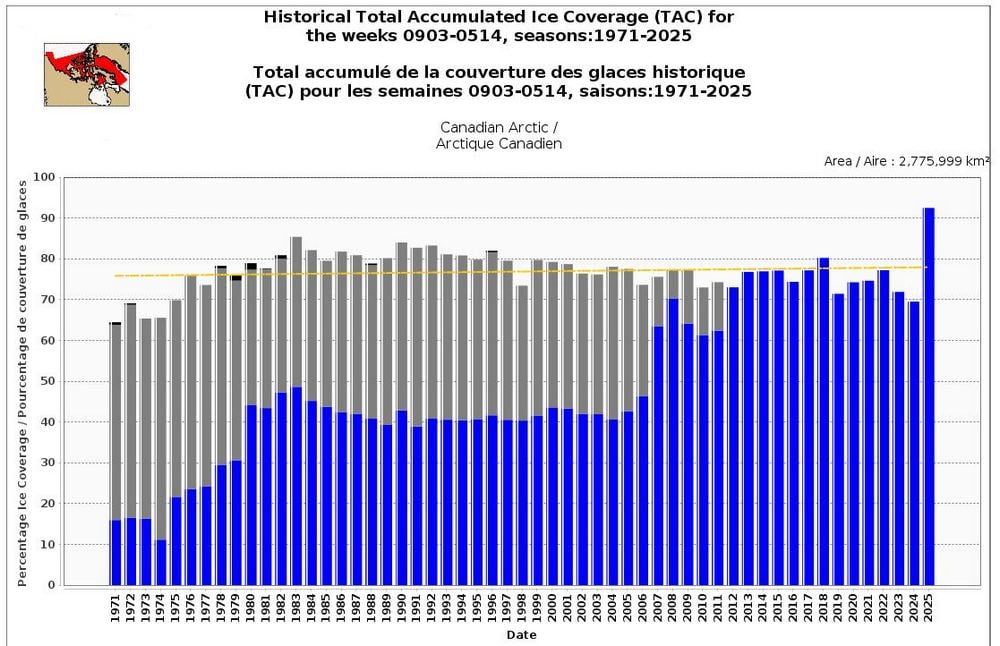
The graph shows the Historical Total Accumulated Ice Coverage (TAC), which is the total area covered by ice for the indicated time period. The blue line is the measured amount. The gray line is a corrected amount, probably due to better measurement systems like satellites in more recent years.
The data shows either a steady increase in ice or ice that is not changing much.
What about the pictures showing less ice? They are real. Global warming will cause more ice to melt in summer, but this is a very tiny amount of the total ice. The amount of ice can also increase in winter due to an increase in snowfall.
Reality:
- Some ice is melting in the summer.
- Most of the Arctic ice is stable.
- There is no ice melt catastrophe.
Ice loss in Greenland
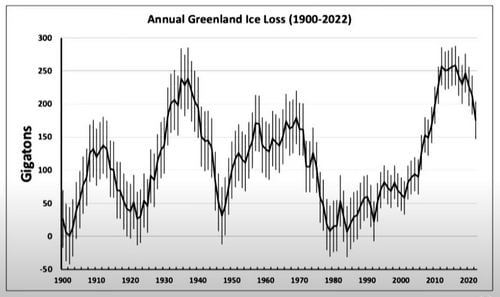
Ice has been melting at a faster rate since 2000. But if you look at 1930, a time when human activity was much less, the increase in ice melting was just as fast as in 2000. It has continually fluctuated up and down over the last 120 years.
The Earth has been warming during this whole time period, but melting has been going up and down. That indicates the two events are not as connected as many claim, and there is more to the story.
Glaciers Are Melting
Temperatures have been rising, and the mountain glaciers have been melting.
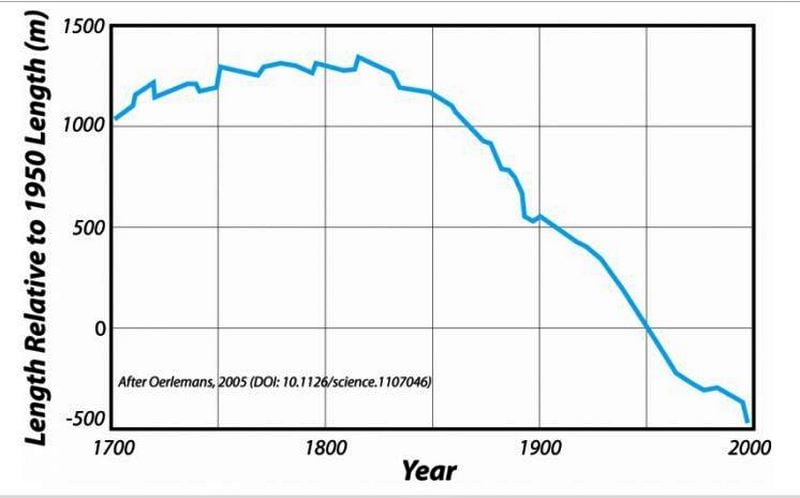
The melting has been attributed to climate warming, not climate change. The melting process does not influence climate change, although it can contribute to sea level rise, which is discussed below.
Melting started about 1850, which is about 100 years before humans started producing CO2 in any significant amount. Clearly, glacier melting can’t be blamed on anthropogenic (human-caused) global warming.
Reality:
- Glaciers are melting.
- It is not a climate change catastrophe.
Are Forest Fires Increasing?
Early last spring, Western Canada seemed to have a lot of forest fires, and the alarmists and news outlets around here were predicting another terrible year due to “climate change”.
Then there was a brief news article. Alberta had declared that every one of their approximately 150 fires was human-caused. They did not say it, but clearly, these were not due to climate change.
Why would climate change cause forest fires? The logic goes something like this. Climate change causes more severe storms, resulting in more lightning. More lightning means more forest fires because it’s the main cause of natural forest fires.

The above chart shows the historical number of forest fires in Canada, which has been declining since the mid-1990s. The data has been confirmed by the Fraser Institute.
So why does everyone think they are getting worse? This is mostly due to poor news reporting, but there is another underlying reason. The severity and cost of them are increasing. This is due to forest mismanagement as well as the fact that more and more people live in forested regions. But this increase in severity and cost is not due to climate change.
It is the summer of 2025, and based on news reports, Canada is having a lot of forest fires. Most are caused by humans.
Forest Fires in the USA
What about the USA? They seem to have a lot of fires, especially in California.
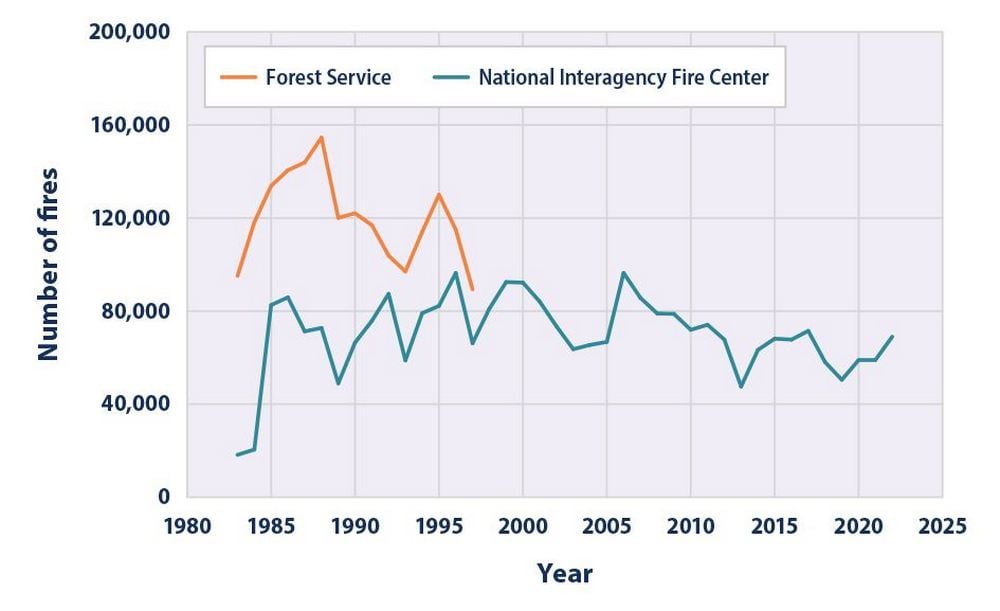
The number of forest fires is not increasing. There is a slight downward trend since 2010.
What about California? Same trend. The number of forest fires has been decreasing since the 1990s.
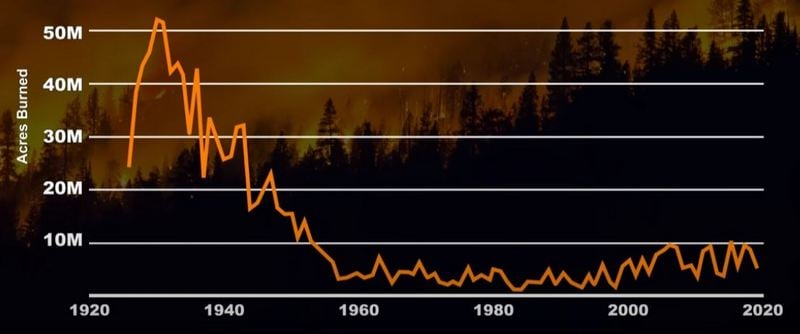
What about longer-term trends? Here is the burnt area for the US since 1926.
Global Forest Fires
A review of global fires, published in 2016, found that “the global area burned by forest fires appears to have overall declined over past decades, and there is increasing evidence that there is less fire in the global landscape today than centuries ago. “
What About the Burned Area?
Several of the comments suggested I am cherry-picking the data. Instead of focusing on the number of fires, I should be looking at the area burned. No one gave a reason why this is a better measure of climate change, and it is probably not better. Burned area depends very much on forest management, which in North America is poor, and on an area’s ability to respond to fires. It is difficult to separate these factors from weather factors.
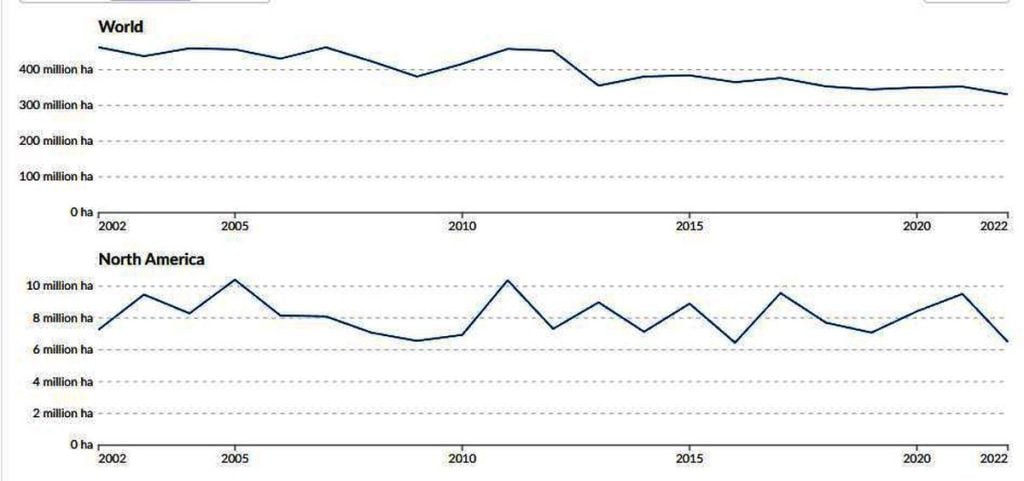
The burnt area in North America is flat, while the global burn area is trending down. The same site also has data for other regions, and they are all flat or trending down.
Reality:
- The number of forest fires is not increasing in Canada, the USA, or globally.
- The burned area from fires is not increasing in North America or globally.
News Changes Its Approach to Scare People About Climate Change
For years, news outlets have been warning about the dire consequences of “Climate Change Caused Forest Fires”. But this year, 2025, has seen a big drop in the number of forest fires, and news outlets have finally checked the facts.
The New York Times has just reported that:
“Costly and Deadly Wildfires Really Are on the Rise, New Research Finds”
Instead of being honest and letting people know that Climate Change is not causing a crisis and that it is not causing an increase in forest fires, they have decided to pivot and focus on “the cost of fire”. Even if their data was right, it only tells us that we are building more structures near forests, and these structures keep getting more expensive every year. That has nothing to do with climate change!
Record Hot Days in the US
It has been a hot summer in North America, and Europe has broken numerous heat records. Are heat waves more common now?
The Heat Wave Index in the US
The Heat Wave Index, more commonly known as the Heat Index or apparent temperature, is a measure of how hot it “feels” to the human body, combining the effects of air temperature and relative humidity. It is used to assess potential health risks during hot weather.
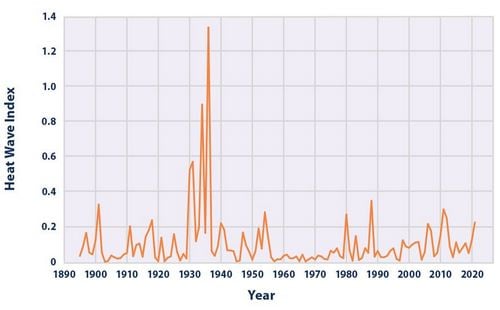
There is no significant change since 1930, and in recent years, the heat index is lower than in the 30’s, before humans produced so much CO2.
Hot Days in the US
The above data shows us how it feels, but it does not show the actual temperature. Does the US have more hot days now than in the past?
This chart shows the average number of hot days per year in the US, with a daily maximum temperature ≥95°, ≥100°, and ≥105°. It is a reconstruction by Chris Martz using official data from the United States Historical Climatology Network (USHCN).

There is clearly no upward trend during the period of 1900 and today.
Annual Average Temperatures in the US
Another way to look at temperature is to measure the average annual temperature.
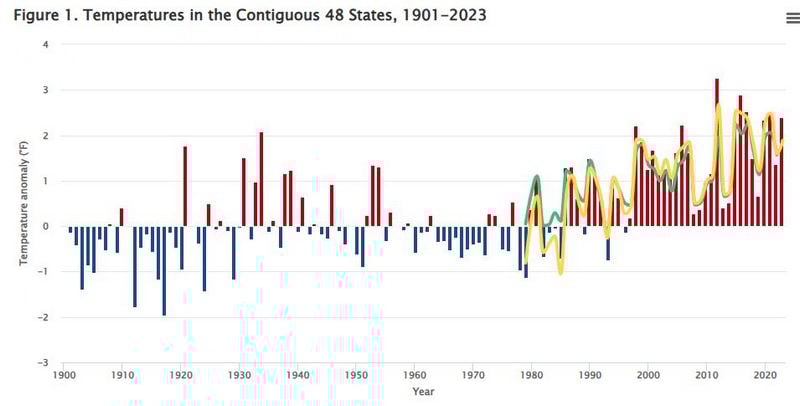
There is a clear trend upwards over the last 100 years, but even in the last 20 years, there are highs and lows, and many of the years are cooler than some years in the 1930s.
Why is the average temperature increasing when the record highs are not? This seems contradictory until you look at nighttime temperatures.
An average temperature is the average between the daily high and low. If the nighttime temperatures (the lows) are trending up and the daytime temperatures remain stationary, the daily average goes up, and that is what is happening. Nighttime lows are getting warmer more quickly than daytime highs.
From a gardener’s perspective, this is a positive trend. Hardiness zones are based on the lows. As they trend higher, cold climates can grow more warm-temperature plants.
Reality:
- Heat waves are not getting worse than in the 1930s.
- Temperatures are steadily going up. Average daily temperatures are increasing mostly due to warmer nights.
- Heat waves and record high temperature days are not as severe as reported in the media.
Are Storms Increasing?
We now have good data about global storms thanks to satellites. We know where they all are and how intense they are.

Tropical storms are not increasing. The number of hurricanes is stable or slightly decreasing. Major hurricanes are stable.
Hurricanes In The US
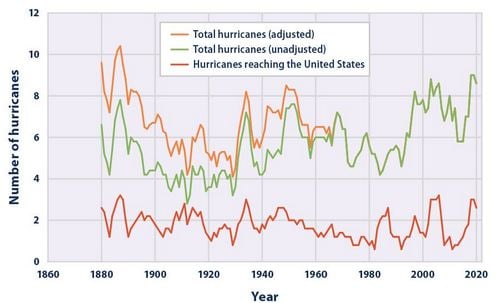
NOAA has reported on the number of major hurricanes to strike mainland USA for each decade since 1951. The average for the entire time is 5.6. The average since 2011 is only 3.5. The highest number occurred between 1941 and 1950, which had 10. Clearly, the number of major hurricanes in the US is not increasing.
Reality:
- The number and intensity of storms are stable, both in North America and globally.
Is Precipitation Increasing?
A satellite study on this concluded “No overall significant trend is noted in the global precipitation mean value, unlike that for surface temperature and atmospheric water vapor. However, there is a pattern of positive and negative trends across the planet with increases over tropical oceans and decreases over some middle latitude regions”.
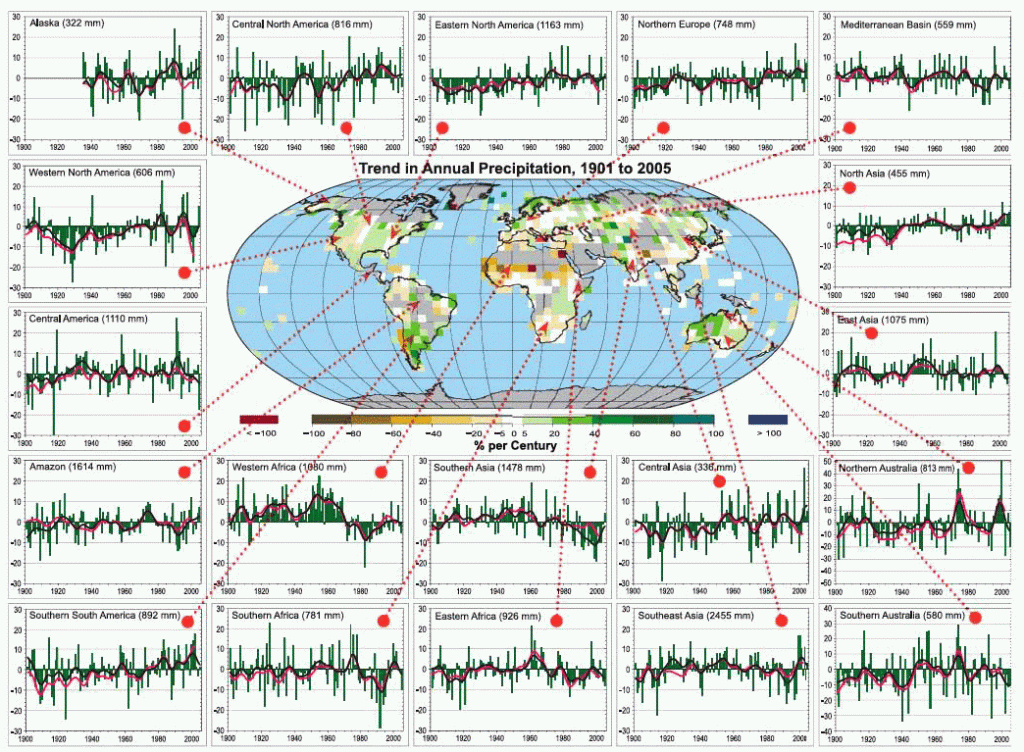

Overall, there is no clear trend in a change in precipitation; however, smaller regions can experience a change. The El Niño-Southern Oscillation (ENSO) cycle and volcanic activity also influence local rainfall.
Reality:
- The amount of precipitation falling globally or in the US has not seen a major change.
Are Sea Levels Rising?
Temperatures are rising, which causes the ice caps to melt, which causes the sea to rise. The news has predicted dire consequences from this, with many island nations being underwater in a few years.
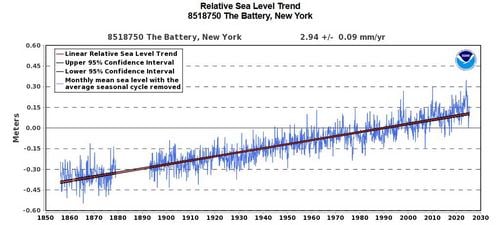
Sea levels have been rising from at least the mid-1800s, and the rise has been fairly stable in New York.
Several of the comments below disagree with this assessment. They claim it is rising at an alarming rate. We can ask the people who live in New York what they think:
- Are New Yorkers fleeing the city? Is the population dropping? No.
- Has the government stopped issuing building permits for New York? No.
- Have companies stopped building? No.
- Has the government started building flood prevention systems? No.
Clearly, the residents of New York don’t think this is a crisis. Neither do I.
A study from 2011 looked at tide-gauge data from 57 US locations and found “the records show small decelerations that are consistent with a number of earlier studies of worldwide-gauge records.”
Sea gauge data does have some issues. Gauges are mounted to land, and we don’t monitor the up or down movement of land very well. If the Earth under a gauge rises, then it will show a smaller sea level rise. And the reverse is also true. For example, New York is sinking, and taking the sea level gauge with it. So the amount of sea level rise in New York is actually less than reported.
Satellite data solves this problem, but it has only been collecting data for 30 years, not enough to determine a long-term trend.
Global Sea Level Rise
An independent analysis of global sea level gauge data was recently done by Roy Spencer, Climatologist and former NSA scientist, who showed that:
- Natural sea-level rise accounts for 1/2″ per decade (5″ per century).
- The human contribution to this is 3/10″ per decade (3″ per century).
A study (2025) that looked at global tide gauge data found that sea level rise is not accelerating in most areas. A few areas are experiencing an acceleration, but this can be explained by land disruptions that have nothing to do with climate change.
This study found that the median sea level rise is 1.5 mm/year, or 6”/ 100 years.
Sea levels are rising, but the rate is low. There is no sign of a short-term problem. The news headline “Melting Ice Threatens Shoelines” is certainly not correct.
Are Islands disappearing?
Islands are not very high, and even small rises in sea level could spell trouble.
You have probably heard of the Maldives? It’s one of the smallest countries in the world and the lowest country on Earth. On average, the ground here is only five feet above sea level. For years, news has warned of a looming catastrophe when sea levels rise.
More than 30 years ago, the AFP international news agency reported that all 1,196 islands that comprise the Maldives could be completely underwater over the next few decades (by 2015).
You would expect the islands to be shrinking as sea levels rise. However, a 2020 study showed that over the past decade, 59.1 % of Maldivian inhabited and resort islands expanded in size. Businesses are increasing the construction of new buildings and resorts. There are potential problems in the future, but for now, there is no looming crisis. All 1,196 islands are still above water.
Another example is the island of Tuvalu, a Polynesian island nation. News has frequently reported that they will sink into the ocean as sea levels rise. However, “a recent peer-reviewed study found eight of Tuvalu’s nine large coral atolls have grown in size during recent decades, and 75 percent of Tuvalu’s 101 smaller reef islands have increased as well”. The citizens are not worried. The population of Tuvalu has increased by 20 percent over the previous 30 years.
Reality:
- Sea levels are rising at a very slow rate.
- Islands are not sinking into the ocean.
Are Coral Reefs Dying
The oceans are getting warmer and more acidic as they absorb CO2. That is bleaching the coral reefs and killing them, or so it is claimed.
There are some important facts about coral that the news outlets ignore:
- Coral thrives in warm water. That is why it is found mostly in warm regions of the world.
- Almost none of the coral reefs in the world have been studied. The one that has been studied the most is the Great Barrier Reef around Australia, and due in part to its vast size, it has only been superficially studied.
- Coral bleaching can be caused by several factors, and it usually recovers in a few years.
- Coral has existed for 60 million years, surviving temperature and carbon dioxide levels significantly higher than those occurring today.
Coral reefs are very difficult to study. You can fly over them and take pictures, but that only shows you the top of shallow reefs. Most of the coral is found much deeper and requires divers to examine it. That is every expensive and why most coral is not examined.
How is the Great Barrier Reef doing? It is doing just fine. It is not dying. In fact, it is growing at both the northern and southern ends.
Growth at the southern tip may not be a surprise. The water there is warming, and that is what coral likes. So it is growing and doing well.
The surprise is that the northern end is also growing in places with warmer water. Ocean warming is not harming it.

The amount of coral in the Great Barrier Reef has decreased in the last couple of years, but it is at an all-time high since 1985.
How are coral reefs doing? It is estimated that 30% will be destroyed or seriously degraded in the next ten years, but not due to climate change.
The causes of reef degradation are many and man-caused: grounding of ships, improperly placed anchorages, destructive fishing practices, such as dynamiting or cyanide poisoning, overfishing, pollution, and sediment runoff.
Bleaching can be caused by sediment and fertilizer pollution. Even sunscreen oil can harm them. It can also be caused by heat waves and cold snaps. In most cases, they recover in a few years.
If ocean warming becomes extreme, coral will simply migrate towards the poles.
Reality:
- Coral is not impacted very much by global warming.
- Coral reefs are expanding where human activity is low.
The Indo-Pacific Warm Pool (IPWP)
The Indo-Pacific Warm Pool (IPWP) is the largest body of consistently warm ocean water on Earth. It is often referred to as the “heat engine of the world” or the “steam engine of the world” due to its immense size and its role in generating heat, moisture, and intense atmospheric convection. The defining characteristic of the Warm Pool is that its Sea Surface Temperature (SST) remains consistently above 28 °C (82.4 °F) year-round.
You would expect that such hot water would have very little coral because it is just too hot for it.
The area is known as the Coral Triangle because it contains the overwhelming majority of the Earth’s coral species and coral reefs. It is home to 76% of the world’s reef-building coral species and makes up approximately 91% of the world’s total coral reef areas.
Coral likes growing in warm water!
Are There More Floods?
A devastating flash flood impacted the Texas Hill Country, particularly along the Guadalupe River in Kerr County, on July 4, 2025, resulting in numerous fatalities and widespread destruction. It was documented by all the news outlets, who blamed it all on climate change.
Was it climate change?
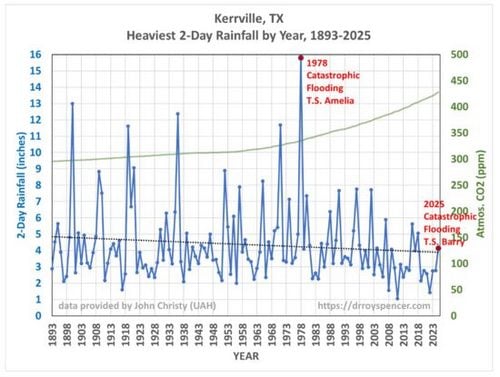
The area is called “Flash Flood Alley“ for a reason. The topography lends itself to such events. For our discussion, the key question is, was this an unusual event? Are floods in his region increasing? A single event is not proof of climate change. We need to see a longer-term trend to blame climate change.
Roy Spencer, climatologist and former NSA scientist, has done a good job analysing this. The rainfall data shows that this was not an unusual event. Flood events have been trending down since the 1978 flood.
Maybe the news outlets should have reported that climate change is reducing flood events?
The Department of Energy’s report entitled, A Critical Review of Impacts of Greenhouse Gas Emissions on the U.S. Climate, reported that “when one looks at rainfall statistics across the U.S. extending back to the mid- to late-1800s, there is little evidence for anything that might be considered related to human-caused climate change”.
Using floods to determine climate change is tricky. A lot of the data shows financial losses, but it should be no surprise that this is going up. More people are living in more floodplains and building expensive buildings. There is also the issue that humans have moved earth to redirect flooding, which in many cases makes flooding worse in one area while protecting another. We can’t blame any of this on climate change.
Reality:
- Flood data does not show an increase in floods in the US
- Floods are largely influenced by human activity on the ground that has nothing to do with CO2 or global warming.
Is Climate Change a Threat
Climate change happens and will continue to happen. The important question is, is climate change a threat to our lives?
Based on the above data, it’s not. The data does not warrant the views of climate alarmists.
The truth is that global warming has been good for humanity. The following shows the impact since 1900. A reduction in deaths due to weather, longer life expectancy, higher GDP, and less poverty. On a global scale, it is hard to find a negative.

Several people commented that the above information is wrong, without providing evidence that it’s wrong. So I checked the data for the weather-related death rate.
It is very clear that global warming is saving lives:

As mentioned in the introduction, I am making this post public before it is complete. I will be adding many other topics in the coming weeks, months, and years.
It is important that all of us understand this topic better, so that we can influence government leaders to act more responsibly. Trying to solve a problem that does not exist costs dearly.
Number of People Killed by Climate-related Disasters
If climate-related disasters are increasing, you would expect more people to die from them. The general public and the news media certainly think so.
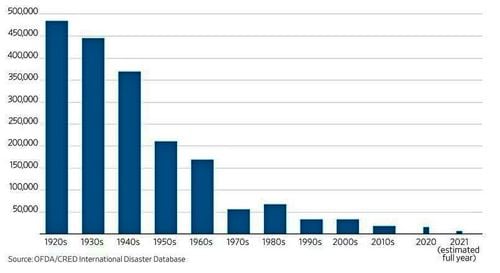
The reality is that the number of deaths from floods, droughts, storms, wildfires, and extreme temperatures has dropped dramatically. Most of this is due to human advancement in technology, but there is certainly no evidence of an increase.
Cost of Disasters
An increase in the number of disasters or the severity of disasters should result in an increase in cost.
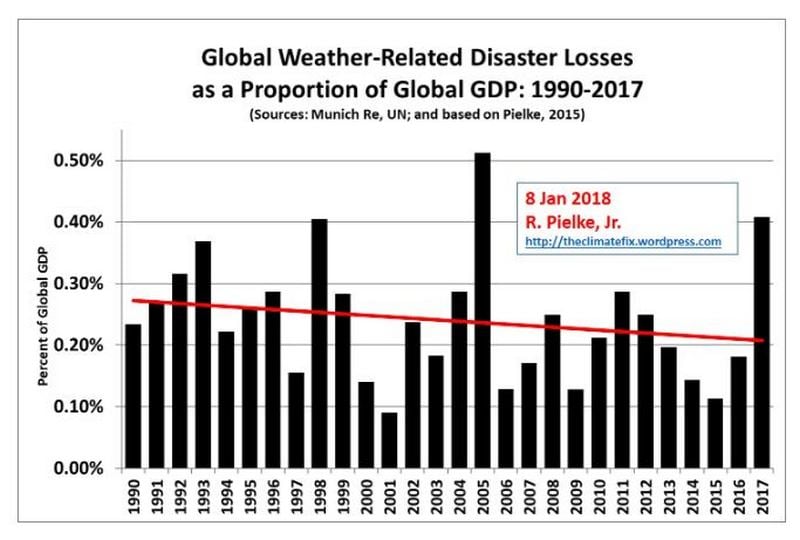
The trend between 1990 and 2017 is down, not up. The opposite if disasters are on the rise.
There are charts that show an increase in actual costs for this time period, but they don’t take into account the increasing value of human-made structures. For NOAA’s charts, they say, “A major driver of increased costs of extreme weather is the increase in population and material wealth over the last several decades”. The above chart, based on GDP, more correctly reflects those costs.


The best book I read in high school, to prep for a debate, was called How to Lie With Statistics. One important component of this methodology was Cherry Picking data. Another is obfuscation. Seems like a fine example of such being presented here. I do believe there is a middle ground of reality between the deniers and the doomsayers that is obscured by both not expending enough effort in examining the entire scope of what’s causing climate change, both man made and natural forces.
Saw an interesting experiment in high school biology. We inoculated a dish of agaragar with mold spores. in a couple days, there were spots of mold here and there, By Friday there was a large colony thriving. When we came in on Monday, the entire colony was dead. Why? Not a lack food. It died of being poisoned by it’s own waste products! We’re crapping in our own pond and there are limits!
You’d think we’d learn yet we now have fools dismissing safeguards meant to prevent such self destructive behavior. So disbelieve we are a contributing factor if you wish, but among other things, I find it hard to believe that the waste products of a billion
( or more ) internal combustion engines, no bearing on climate modification!
In your conclusion, you state, “The truth is that global warming has been good for humanity.” You then go on to provide a chart of why, including 34% higher food production, our population is 5x larger, our life expectancy is 130% longer, and more. But correlation is not causation, and I am not aware of any studies or data that provide a causal link between global warming and any of those positive changes (if you have them, please share).
And food production hasn’t increased by 34% since 1900; it has more than tripled globally in the past 50 years alone. Why? For reasons you document in your blog all the time: advancements in (1) plant science, (2) fertilizers, (3) irrigation (including equipment), and (4) pest control. Additionally, mechanization of farm equipment, improvements in crop varieties, expansion of agricultural land, and increased demand due to population, amongst many other reasons not connected to climate.
The same consideration about any of the other statements in your conclusion easily dissociates them from global warming/climate change.
Mankind is having an impact on climate change, Exxon Mobile itself has accurately predicted it as well as any independent scientist:
https://www.science.org/doi/10.1126/science.abk0063
Arctic sea ice is decreasing:
https://nsidc.org/sea-ice-today/about-data
Fire season is getting longer and more extreme:
https://science.nasa.gov/earth/explore/wildfires-and-climate-change/
Heat waves are increasing in duration and intensity:
https://www.epa.gov/climate-indicators/climate-change-indicators-heat-waves#:~:text=Data%20%7C%20Technical%20Documentation-,Key%20Points,between%20the%201960s%20and%202020s.
Ocean warming has intensified storms:
https://www.climatecentral.org/climate-matters/hurricane-strength-attribution
You document that at least 3” out of 5” of sea level rise is attributable to mankind.
Coral reefs are on the decline:
https://gcrmn.net/2020-report/
Floods are increasing in frequency and impact:
https://esd.copernicus.org/articles/9/757/2018/#:~:text=Frequency%20and%20duration%20of%20floods,atmospheric%20teleconnections%20explaining%20this%20trend.
But I think you have access to all of this information, and the ability to read it…if you want to.
Lets discuss one of those.
Heat waves are increasing in duration and intensity:
https://www.epa.gov/climate-indicators/climate-change-indicators-heat-waves#:~:text=Data%20%7C%20Technical%20Documentation-,Key%20Points,between%20the%201960s%20and%202020s
That is the same reference I used, so I assume you accept the data as correct.
Fig 1 – shows 10 year averages since 1060s
Fig 3 shows annual data for a longer period of time including the 1930s
Seems like Fig one is cherry-picking the data to exclude the highest values?
Fig 1 does show a steady increase in heat wave days. It went from 2 in 1960s to 6 in the 2020s, a 300% increase. But remember these are 10 year averages – not annual values.
During that same time, CO2 levels went from 320 to 420 ppm, according to NOAA. This is a 30% increase. Based on the popular understanding of the greenhouse effect, how do you correlate these two rates of change? Is there another factor involved that is not human caused CO2?
Fig 3 shows a more granular look at the yearly heat wave days and it clearly shows no trend. It also shows a huge spike in the 1930s, when there was limited human activity producing CO2. Given the popular scenario of CO2 causing warming, how can you account for this chart?
Given that CO2 is increasing since the 30s, and heat wave days on an annual basis are not increasing, the most obvious conclusion is that CO2 has no effect on heat wave days.
I agree that correlation is not causation, but when you compare CO2 increases to annual changes in heat waves, there is not even correlation.
Figure 1 shows a clear trend of heat wave frequency, duration, season, and intensity increasing. Figure 3 is not a granular look at heat wave days. It is looking at a heat wave index… you’re reading the data wrong.
I see that you also ignored my comments about your conclusion, as well as the many other links provided. If this is something you wanted to expand upon in the future, wouldn’t you be carefully reading all the data?
On a side note, I read your blog to understand more about gardening, not your opinions on a subject that is not your area of expertise. But, to be honest, after figuring out that most of your references in other blog posts are actually links to your own blog posts (and not controlled studies), I’m not sure your content is worth reading anymore. A glaring example is your 3-1-2 is the best fertilizer ratio post…but you have no references to support that. When I went to look, I found two controlled studies for two specific plants that grew well with that ratio, but most studies I saw don’t support this notion…perhaps Garden Myths is making its own garden myths?
Let’s look at one of your concerns, the “Exxon Knows” claim:
Mankind is having an impact on climate change, Exxon Mobile itself has accurately predicted it as well as any independent scientist:
https://www.science.org/doi/10.1126/science.abk0063
Perhaps you didn’t notice that the linked article, although published in a venerable journal, strays far from science and just makes claims/accusations about “the fossil fuel industry”. Why is such an article, arguing for punishing an industry, considered fit for publishing in Science? The sad answer is that formerly respectable science journals have largely been taken over by activists who see them as vehicles for promoting ideological views, climate alarm being the dominant one. That Science article is a glaring example and should give a thoughtful person pause. But we’re in the age of climate cultists determined to push their opinions, not scientific data, on readers. Those in the club feel this is simply right and that those outside it deserve denunciation.
The claim that Exxon scientists “knew” that fossil fuels would cause global warming is really an acknowledgement that those scientists were, like many of their peers, creating climate models that assumed atmospheric CO2 strongly affected terrestrial temperature. All anyone can know from model output is what the algorithms and input parameters produce. That’s math and not at all the same as knowing how the global climate system works. I still smile when I consider the realism embodied in this Dilbert strip (https://principia-scientific.com/dilbert-1-scientists-0/).
Scott Adams’ cynical cartoon aside. We dont need the models. We can measure the phenomenon. We can see the isotopes proving its fossil fuel CO2. We can see the altitude of the cooling. We can see the radiative forcing. We can measure the ocean temps. We can predict the values and prove them with measurement. That Exxon recognized the physics just say they are good scientists.
I have always admired your scientific approach to gardening. It is clear to me though that you need additional study to understand climate. Several examples:
– You say in your discussion of clouds that ‘water vapor is just as good a greenhouse gas as CO2’. Water vapor is a greenhouse gas, but it affects different wavelengths of the radiation leaving earth than CO2 does. Each molecule, because of its vibration modes, interacts with different wavelengths of light. The reason CO2 is so important is that it interacts with different wavelengths. So while, over most areas of earth, water vapor already affects most of the radiation in its wavelengths, CO2 adds a whole different set of wavelengths, greatly increasing the total greenhouse effect. And the effect of clouds is not because of the water vapor in them, but because clouds can reflect incoming sunlight and reflect some outgoing heat. This has been an active area of study by climate scientists, and the emerging understanding is that the effect of clouds depends on the type of cloud (cumulus, cirrus etc) and their height. This ongoing study of clouds in no way undermines the general understanding of climate change
– Your graph on ‘Total Accumulated Ice Coverage’ is of ice in the Canadian Archipelago, not the entire Arctic, and it is only for the winter months. That area (and most of the arctic north of it), even with climate change, still almost always fully freezes in winter. It will be a truly bad sign for the climate if even in winter that area does not freeze. If you want to see the state of Arctic ice, look at the strongly decreasing area and extent of ice in late summer (try https://forum.arctic-sea-ice.net/index.php)
– Perhaps simplest is your graph purporting to show warming is good for humanity. You could replace ‘global temperature’ in the top line with ‘US population’, ‘acres of soybeans grown’, or ‘years since 1800’ and then conclude each of these was causing positive effects for humanity. Correlation is, of course, not causation.
I am not a climate scientist, but have spent years studying the science. I suggest you do the same before posting on the subject.
Your link for arctic ice is for a discussion group? Do you have a link to the data?
As mentioned in the post, this one is not about CO2.
That ‘discussion group’ is full of many links to many different sources of data. This is not a simple topic where one chart explains all. You can browse through to find topics that interest you. There is a section called ‘Arctic background’ with historical data, science explanations etc.
Here’s another link I used to start my study of the subject: https://scienceofdoom.com/roadmap/ Maybe an unfortunate name, but I found it a mostly understandable introduction to the science. Takes a while to get through, and more study is needed to really be up to date, but a good start. I’d start at the beginning of the road map and keep working.
On just the current state of Arctic ice, with comparisons to the past, maybe this would be good: https://nsidc.org/sea-ice-today
Unfortunately, fossil fuel companies are rich, and they can put out huge amounts of rational sounding misinformation. You have to work to understand the basics of the science to try to separate the truth from propaganda (just like you do with garden science, but climate is much more complicated..)
It’s amazing what you can do when you cherry pick data. Ice coverage? Well the same website has other graphs available and a literal summary that states ice is decreasing and forming later and breaking up earlier: https://www.canada.ca/en/environment-climate-change/services/ice-forecasts-observations/latest-conditions/climatology/ice-climate-normals.html
Or coverage of the entire arctic rather than just the Canadian bit: https://nsidc.org/sea-ice-today/analyses/peak-summer-depths-winter
The Greenland chart is from an article by Steven Koonin, a renowned sceptic known for cherry picking and muddling things (but I guess maybe that’s because he’s not an actual climate scientist?): https://climatefeedback.org/evaluation/wall-street-journal-steven-koonin-publishes-misleading-claims-climate-change-influences-greenland-ice-melt/
I wouldn’t dispute the figures of forest fires in Canada but from a global perspective they are increasing: https://www.wri.org/insights/global-trends-forest-fires
The hurricane statement that they are stable in number and intensity is at odds with the statements on the EPA website from where you pulled the graph “The results described above generally align with global trends reported in the most recent assessment by the Intergovernmental Panel on Climate Change. Studies generally agree that tropical cyclone intensity has increased around the world over approximately the past 40 years, but changes in observation methods over time make it difficult to know whether intensity or frequency have increased over the full period with available data”
I’m sure I could find opposing info on all the other areas but have neither the interest or time.
“But scientists do not agree on the cause of this warming” Well the majority of Climate Scientists do.
“Many top scientists are quite sure humans are not causing global warming” Which top climate scientists are sure it’s not humans causing it?
This is a very disappointing post from you. You clearly seem to have gone down the conspiracy rabbit hole.
I can make the same claim for you comments.
“Or coverage of the entire arctic rather than just the Canadian bit: https://nsidc.org/sea-ice-today/analyses/peak-summer-depths-winter”
The data for this link shows that ice extent has decreased when you compare the last 5 years with the 1981 to 2010 average. It does not show the yearly change which is important to understand if the recent values are significantly different.
Surface ice is melting – the article acknowledges this, “What about the pictures showing less ice? They are real. Global warming will cause more ice to melt in summer, but this is a very tiny amount of the total ice. ” That seems to agree with the data in your link.
Everywhere I go on Earth the locals tell me that they are having exceptional weather.
In my own forest in Shropshire, England, there have been two highly unusual northerly storms in recent years that have felled many mature trees. The replacement saplings that I have planted are now dying due to an exceptionally severe drought.
That’s anecdotal, but the scientific data show that without doubt climate change is very rapid. And we haven’t even hit the likely tipping points after which change accelerates.
Do you have children and grandchildren?
Are you confident that they will live out their lives without having to endure the harmful effects of climate change caused by human actions? Perhaps you should write a letter for them to read in 2075 explaining how you protected the planet for them.
But the data does not support these personal opinions.
“Are you confident that they will live out their lives without having to endure the harmful effects of climate change caused by human actions?” – I am more confident now that I have spent significant time looking at the data.
I don’t believe most of climate change is human caused.
I do believe, that we have been duped by the media and activists into believing this story. And that politicians are doing the wrong thing to solve it, and that will harm society.
“I don’t believe most of climate change is human caused.”
You’re making the assertion so support it with evidence instead of using this claim to handwave away counterpoint.
No. I am expressing my opinion that after looking at all the data I agree with the scientists that have expressed this idea and who have also provided the data to support their opinion.
Provide one good example please. Pick the best of the “top scientists”.
“There is also no evidence for the claim that humans are the cause of global warming. We contribute a small amount to the problem, but other forces are the real cause.”
This is a claim I believe I have offered sufficient evidence to debunk and you have offered scant evidence to support. You did say you would address this in a future post, but you’re making the assertion now, so….why do you assert this contrarian position?
You have offered no evidence. All you have done is repeat the jargon used by climate activists.
Thankfully you did say you weren’t a climate scientist. Cherry picking a few graphs out of the vast wealth of evidence out there doesn’t help your reputation. Read more widely and not just articles that help your opinion.
Can you point to one of the sets of data to show it is wrong and provide evidence to that effect?
Robert, I really thought you understood science better than this. This is hugely disappointing to me as a scientist (PhD, ecology) who has enjoyed your gardening content for years.
You obviously have a contrarian streak, but that of course can be a good thing when you’re disputing old wives’ tales about tomatoes and the marketing gimmicks of fertilizer companies. That’s using science to dispel public misconceptions. A very different standard of reasoning and evidence needs to be met when disputing the peer-reviewed literature. Even when disputing a single study (many of which are in fact wrong), the critique must be much stronger than what you’ve done here: a clear explanation of how a violation of statistical assumptions led to a bad inference, for example, or a subtle case of p-hacking, or a plausible alternative interpretation of the data that the authors missed. When disputing the consensus of the peer-reviewed literature from a well-studied field, the burden of proof is vastly higher still. You need to provide rock-solid reasoning and evidence for how and why the literature got it so wrong. The level of rigor required would make your contention worthy of a scientific publication itself, and if you were right about something so dramatic, you’d be on the fast track to a Nobel Prize. Of course, you’re not.
What you’ve provided, instead, is a cherrypicked selection of graphs that don’t undermine the scientific consensus in any way except in your misunderstanding-riddled imagination.
This is most comically evident in the figure you pulled from https://www.epa.gov/climate-indicators/climate-change-indicators-wildfires (you took Figure 1) which shows that wildfires have not increased in frequency over time. If you had bothered to click through to Figure 2 on that same page, you would see that the acreage burned is on a dramatic upward trend over that same time period. Of course, there could be some other explanations for that trend ranging from short-term climate cycles to forest management practices, so nobody squinting at charts on a website is really qualified to draw firm conclusions from these single graphs. Do you want to take a wild guess at who’s putting years of rigorous work into taking all those other variables into account and identifying real climate signals? Climatologists!
In one reply you said you’re looking at “the facts we have today, not future projections.” It’s stupid to ignore future projections, because many aspects of the future are predictable. I can tell you right now that next January is going to be colder at your house than next August. And the primary concerns about climate change are not about the warming that has already happened but the warming that will happen in the future if we fail to curb emissions. This is one of the mistakes you make repeatedly throughout your post: saying that the change experienced so far is not so bad (e.g., sea level change), so there’s nothing to worry about. In the case of sea level rise, the concern is obviously that the mechanisms causing it are going to increase nonlinearly with temperature, so it stands to be a very serious problem with more dramatic warming. If you have an issue with the predictions, don’t just dismiss “predictions” out-of-hand—that is absolutely moronic and I would have considered it beneath you until today. Find specifically where the predictions went wrong. Did they get the math wrong? Did they use the wrong priors or statistical distributions somewhere? Did they calibrate based on a faulty dataset and fail to account for the uncertainty that introduces? Find the mistakes. That’s how science works. Not this lazy bullshit.
As for coral and oceans more generally, the major concern with climate change is that high CO2 levels will acidify the oceans to a point that interferes with the calcification processes that are critical to coral as well as zooplankton that are vital to all the major food webs. The level hasn’t hid that point, so of course we’re not going to see a signal from it yet. But there are other clear signals of climate change, including many species ranges shifting farther toward the poles. The same is true on terrestrial landscapes.
Even if one concedes incorrectly that we shouldn’t pay attention to projections, there are clear signals of anthropogenic climate change right now, in widely available graphs you conveniently omitted from your post. For example, this one shows CO2 levels rising substantially and global average temperature with them:
https://royalsociety.org/news-resources/projects/climate-change-evidence-causes/basics-of-climate-change/
You could argue “correlation is not causation” and that perhaps there’s more to the story, but again, this is why climatologists have been considering these trends from every angle, looking at every source of uncertainty, every possible bias, and everything else one can imagine taking into account—and they overwhelmingly conclude that anthropogenic climate change is real. It looks real from an amateur look at the correct charts, and it looks real when you take seriously the experts who spend years diving into the details.
Regarding the Texas flood: yes, the media frequently assigns to climate change events which were caused by ordinary weather variation. That’s unfortunate. A legitimate contrarian could criticize the media for this tendency. It does not in any way undermine the scientific consensus that anthropogenic climate change is real, because that consensus does not rely on over-interpreting individual weather events.
You pointed out in another reply that “climate has changed very fast in the past.” Changes this fast are historically very rare and usually caused by some sort of massive disaster like a huge volcano or asteroid, but that’s beside the point. If this level of change had happened a thousand years ago, we could all just pick up our tents and move them up the hill. Problem solved. Now our society is incredibly dependent on the current sea level, rainfall patterns our the current bread baskets, and other aspects of the climate as it stands today. Rapid change is a disaster for humanity at this stage.
Also, you can’t expect anybody else to post a very comprehensive rebuttal to your nonsense, because your site auto-reloads the page every so often (10-15 minutes?) and destroys pending replies. I had to restart this one twice before I realized your page was doing it and not an accidental misclick.
If you have recently been diagnosed with dementia, then I apologize for my tone.
“This is most comically evident in the figure you pulled from https://www.epa.gov/climate-indicators/climate-change-indicators-wildfires (you took Figure 1) which shows that wildfires have not increased in frequency over time. If you had bothered to click through to Figure 2 on that same page, you would see that the acreage burned is on a dramatic upward trend over that same time period.”
This is a good example of how people use data incorrectly.
The claim made is that climate change produces more storms, which produces more lightning, which produces more fires.
The data I included shows this is not true.
What does the data about burnt area tell us about climate change? The increased areas burned can and are blamed mostly on forest mismanagement. we have not allowed natural forest fires to clean up forested areas for a very long time. That has resulted in excess fuel sitting on the ground, which results in fires that burn hotter and faster than normal. this has nothing to do with climate change.
Beside that the data for global burned areas shows a decline, not an increase. I’ll be adding this chart shortly.
As mentioned in this post, it is not about CO2 and it’s causes. Those will be dealt with in another post. I never claimed that CO2 was not rising. I also never claimed that the increasing CO2 causes problems.
More intense rain during rain period = more fuel growing
More intense drought during dry period = fuel drying faster. This is expanding the “fire season” due to “hydro climate whiplash”.
You keep saying things without providing any evidence. Show us some data that supports the idea that the climate change has resulted in less forest fires, but more burned area.
Then also provide some evidence that climate change has resulted in more burn area in North America, while at the same time resulting in a steady decrease of burned are globally – I’ll be adding this data to the post.
Here is the link to the hydroclimate whiplash study. I offer it because you’ve over simplified the reality were facing re wildfire season. You also didn’t address the point that the recent LA fires happened in January.
https://www.nature.com/articles/s43017-024-00624-z
I can offer this work:
“The latest data confirms what we’ve long feared: Forest fires are becoming more widespread and destructive around the globe”
https://www.wri.org/insights/global-trends-forest-fires
This seems to be a private group. The data I presented comes from NASA.
Unless there is some very compelling reason to discount NASA – I’ll stick to their data.
Robert: “This seems to be a private group. The data I presented comes from NASA. Unless there is some very compelling reason to discount NASA – I’ll stick to their data.”
Fair dinkum, but NASA says that humans are causing warming – which you dismiss – and NASA says wildfires are getting worse:
“NASA’s Terra and Aqua satellites detect active wildfires twice each day. Scientists studied this data over a 21-year span and found that extreme wildfires have become more frequent, more intense, and larger. The largest increase in extreme fire behavior was in the temperate conifer forests of the Western U.S. and the boreal forests of northern North America and Russia. Warmer nighttime temperatures are a major contributing factor, allowing fire activity to persist overnight.”
https://science.nasa.gov/earth/explore/wildfires-and-climate-change/
https://www.nature.com/articles/s41559-024-02452-2.epdf
“NASA says that humans are causing warming” – never said that – stop putting words in my mouth.
Robert you have open a can of worms here. I hope they are organic worms.
LOL!. Yes, as I’ve read through the latest comments it has become clear that the true believers always claim science is on the alarmist side and insist evidence to the contrary is “cherry-picked”. There’s a strong tendency to reference “studies” based on computer models as evidence and to avoid addressing the questionable assumptions baked into the models. The idea that a trace gas (CO2 being about 0.04% of dry air) that is a tiny part of our ever-churning atmosphere can act anything like a greenhouse film doesn’t seem worthy of their attention. But I expected to see the pushback on Robert’s article, considering how deep-rooted climatism has become and how many people, scientists and others, have careers that depend on it.
The real push to questioning a lot of the climate change so-called “facts” came when I studied the CO2 greenhouse effect more and realized that climate alarmists can’t actually explain how the greenhouse effect works, or how the 0.04% can have such a huge impact given some well known and accepted atmospheric physics.
I am a climate alarmist (its quite alarming) and I believe I am up to this task of explaining.
The sun shines upon Earth and the when the sunlight hit the surface warms and emits IR radiation. This radiation is “trapped” by greenhouse gases in the atmosphere. As CO2 increases the escape altitude of the IR raises and less heat escapes raising the surface temps.
That sound right?
This article presents a very selective and misleading view of climate science. It cherry-picks data, and uses a few specific, often outdated, examples to contradict well-established, global scientific consensus. Makes lots of strawmans. The claims about stable sea levels, decreasing forest fires, and unaffected coral reefs are directly contradicted by extensive data from international organizations like the IPCC, NASA, and NOAA. It’s crucial to rely on the overwhelming body of peer-reviewed research, not on isolated anecdotes or misrepresented data from a single source. Focus on what comes from newspappers and politicians instead of scientists.
” uses a few specific, often outdated, examples” – What?
The charts contain recent data and are the currently available data.
“stable sea levels” – never made such a claim – read the post. It actually says, “Sea levels have been rising from at least the mid-1800s, and the rise has been fairly stable in New York.”.
“decreasing forest fires,” – the data is the official record of forest fire numbers.
It’s refreshing to have this contribution to a proper discussion of the topics that climate alarmists keep raising. I sense that more people are realizing that the doomsayers are wrong and just running on ideology and their political views. Like you, I used to think there was validity to the “carbon footprint” concern and worry about global warming, and I even donated annually to Greenpeace. But looking for more detail to satisfy my scientific curiousity, all I found was explanations of the Greenhouse Effect and denunciation of dissenting scientists. It was the latter where I found actual data, Climate4You.com being an especially rich source for global data.
Regarding sea level rise, subsidence is the reason it has risen more and faster in some places than others. Even Scientific American, despite becoming increasingly political, published an article describing the situation for New York City (https://www.scientificamerican.com/article/new-york-city-is-sinking-under-its-own-weight/). Climate alarmists have a different perspective, of course.